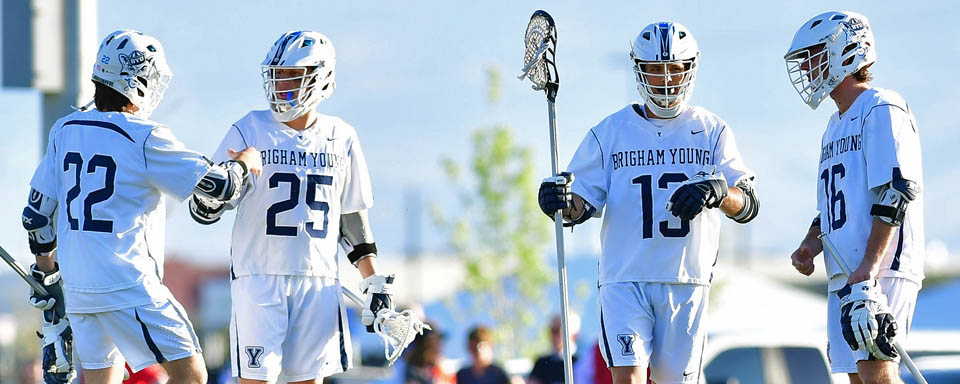
The MCLA did a Top 25 (plus 9 more) so we did the same. W%=Winning Percentage, SOS=Strength of Schedule, W=Win Ranking, L=Loss Ranking.
| – | Team | W% | SOS | W | L |
| 1 | Brigham Young | 100% | 22 | 9 | 1 |
| 2 | Concordia-Irvine | 90% | 9 | 3 | 12 |
| 3 | Virginia Tech | 90% | 35 | 1 | 15 |
| 4 | Clemson | 85% | 16 | 2 | 16 |
| 5 | Florida | 91% | 52 | 9 | 13 |
| 6 | Liberty | 91% | 40 | 12 | 14 |
| 7 | Georgia Tech | 83% | 28 | 8 | 18 |
| 8 | South Carolina | 67% | 1 | 4 | 24 |
| 9 | Minnesota | 100% | 78 | 13 | 1 |
| 10 | California | 82% | 26 | 6 | 19 |
| 11 | USC | 70% | 12 | 11 | 36 |
| 12 | Arizona State | 64% | 18 | 14 | 22 |
| 13 | Northeastern | 100% | 71 | 21 | 1 |
| 14 | Arizona | 67% | 19 | 15 | 32 |
| 15 | Boston College | 64% | 10 | 5 | 49 |
| 16 | Colorado State | 67% | 32 | 20 | 26 |
| 17 | College of Idaho | 100% | 121 | 29 | 1 |
| 18 | Santa Clara | 67% | 24 | 16 | 43 |
| 19 | Chapman | 50% | 4 | 6 | 60 |
| 20 | Grand Canyon | 56% | 14 | 23 | 30 |
| 21 | Dayton | 100% | 75 | 32 | 1 |
| 22 | Utah Valley | 63% | 8 | 25 | 32 |
| 23 | James Madison | 78% | 58 | 31 | 17 |
| 24 | Cal Poly | 40% | 5 | 22 | 41 |
| 25 | Kennesaw State | 100% | 111 | 35 | 1 |
| 26 | UC Santa Barbara | 50% | 6 | 18 | 53 |
| 27 | Boise State | 57% | 20 | 24 | 42 |
| 28 | Florida State | 45% | 23 | 19 | 54 |
| 29 | St. Thomas | 90% | 77 | 28 | 34 |
| 30 | Dominican | 55% | 24 | 26 | 48 |
| 31 | Michigan State | 75% | 72 | 44 | 20 |
| 32 | Grand Valley State | 88% | 88 | 42 | 29 |
| 33 | Georgia | 40% | 7 | 30 | 43 |
| 34 | Florida Gulf Coast | 75% | 68 | 39 | 31 |


