
This was originally published in the Sun Nov 5, 2023 edition of Expected Goals, my daily newsletter.
The analysis covers Sacred Heart's performance in the 12 games they played during the 2023 season against conference opponents and teams with similar LaxElo rankings. Against these teams, Sacred Heart recorded a 5 - 7 record, so let's dive in and see which facets of their game were most important in determining whether a game was one of the seven or one of the five.
A critical factor in Sacred Heart's performance appears to be the team's assist-to-turnover ratio. When the ratio is above 0.36, the team has a significantly better performance, with a 5 - 2 record and an offensive efficiency mark of 35%. However, when the ratio dips below 0.36, the team struggled considerably, failing to record a single win in 5 outings and scoring only 22% of the time.
Jake Ward's performance also had a telling impact. Interestingly, in games where Ward recorded at least one turnover, Sacred Heart performed better, with a 5 - 4 record, as opposed to the 0-3 record they put up when he didn't have a turnover. Yes, they were better when he was turning the ball over. Obviously, it's not that the turnovers helped, but typically, this is a signal that a team needs a certain player to be aggressive for the offense to click. And you can see that in a separate (albeit less critical) threshold related to Ward. When he took six or more shots in a game, the team had a perfect 3 - 0 record, as opposed to a 2 - 7 record when he took less than six shots.
In summary, Sacred Heart's performance appears to be heavily influenced by their assist-to-turnover ratio and how involved Jake Ward was in the offense. Useful nuggets to understand what made their offense tick last season.
Get smarter about college lacrosse in 5 minutes per day. Sign up for Expected Goals today.
Lacrosse Analytics
-
laxreference
- Posts: 1128
- Joined: Wed Aug 29, 2018 3:54 pm
- Contact:
Re: Lacrosse Analytics
Data Engineer/Lacrosse Fan --- Twitter: @laxreference --- Informed fans get Expected Goals, the new daily newsletter from LacrosseReference
-
laxreference
- Posts: 1128
- Joined: Wed Aug 29, 2018 3:54 pm
- Contact:
Re: Lacrosse Analytics
LaxElo ratings produce a pre-game win probability by looking at the gap between the teams. Accuracy for the system as a whole is evaluated based on whether those projections are well-calibrated.
So if there are 100 games where the model gives one team an 80% chance to win, then the model is well calibrated if 80 of those favorites win and 20 of those favorites lose.
For example, in the 2023 season, there were 62 games where the model gave the home team between a 30% and a 40% chance to win. The average win-probably was 35.1% and the home team won 32.3% of those games. The worst bucket last year was the 50 games where the home team was given between a 50% and 60% chance to win. Those home teams won 62% of the time.
LaxElo is meant to be a forward-looking system. The whole point is to provide a reliable estimate of who would win a future game. It's not designed to be a measure of how good a team was, which is why it typically doesn't square with media polls.
You mentioned that it's slow to reward teams that had a successful 2023. And that's exactly the point, it only rewards teams for past success to the degree that doing so helps it to predict future outcomes more accurately. And the optimal speed for that is not very fast at all.
Data Engineer/Lacrosse Fan --- Twitter: @laxreference --- Informed fans get Expected Goals, the new daily newsletter from LacrosseReference
-
laxreference
- Posts: 1128
- Joined: Wed Aug 29, 2018 3:54 pm
- Contact:
Re: Lacrosse Analytics
With every game that an Elo model sees, the weights of the previous games are diluted. The most recent game is given the highest weight. The next most recent is the next highest weighted. The oldest game in the sample still has a very small impact on the current LaxElo rating.jrn19 wrote: ↑Mon Nov 20, 2023 7:58 pm
If the Elo is trying to inform the results for an upcoming season, I do not see how you cannot weigh recent seasons more heavily, as in the sport returning production over a given year, as well as the fact the top teams usually gravitate to the top year, in year our usually inform who’s going to be the best teams in that season.
Long way of saying that it definitely weights the most recent season the most.
Data Engineer/Lacrosse Fan --- Twitter: @laxreference --- Informed fans get Expected Goals, the new daily newsletter from LacrosseReference
Re: Lacrosse Analytics
But if you’re trying to predict future outcomes, you need a baseline, and while prior season success should not be the whole pie, it does inform what will happen the next year to a good degree. 8/17 teams in the tournament were in the tournament the year before and 4/8 seeds were in the tournament the year before and 3 were seeds the year before. Even going back 5 years now, 11/17 teams in the 23 tournament were in the 19 tournament. 5/8 seeds were seeds in 2019. This is a sport where the teams at the top generally are entrenched there.laxreference wrote: ↑Wed Nov 22, 2023 2:27 pmLaxElo ratings produce a pre-game win probability by looking at the gap between the teams. Accuracy for the system as a whole is evaluated based on whether those projections are well-calibrated.
So if there are 100 games where the model gives one team an 80% chance to win, then the model is well calibrated if 80 of those favorites win and 20 of those favorites lose.
For example, in the 2023 season, there were 62 games where the model gave the home team between a 30% and a 40% chance to win. The average win-probably was 35.1% and the home team won 32.3% of those games. The worst bucket last year was the 50 games where the home team was given between a 50% and 60% chance to win. Those home teams won 62% of the time.
LaxElo is meant to be a forward-looking system. The whole point is to provide a reliable estimate of who would win a future game. It's not designed to be a measure of how good a team was, which is why it typically doesn't square with media polls.
You mentioned that it's slow to reward teams that had a successful 2023. And that's exactly the point, it only rewards teams for past success to the degree that doing so helps it to predict future outcomes more accurately. And the optimal speed for that is not very fast at all.
If it’s meant to be forward looking, what are the inputs that tells us going forward, Jacksonville is going to be better than Hopkins? Or Saint Joe’s better than Penn State? Is it results from 2022? That would make more sense, but I’m not sure if that’s as reliable as the more recent results if we’re trying to inform 2024. Obviously returning production, things like that need a equitable weight too
Re: Lacrosse Analytics
did not read it all, but if this is about ELO predicting 2023, it is just not very good. None of the models are particularly good prior to the season. The Football outsider guys used to wait until about week 6-7 to start putting their stuff out. Like any model the more inputs the better it gets. Most models are going to need about 50% of the season to be played before their predictive models are reasonably predictive.
-
laxreference
- Posts: 1128
- Joined: Wed Aug 29, 2018 3:54 pm
- Contact:
Re: Lacrosse Analytics
This was originally published in the Wed Nov 1, 2023 edition of Expected Goals, my daily newsletter.
UMass-Lowell's offensive performance was less than impressive in the 2023 season. Their efficiency dropped from 25.8% in 2022 (58th nationally) to 22.4% in 2023 (71st nationally). This decline was largely driven by an increase in turnover rate, which rose from 36.9% in 2022 (ranked 62nd nationally) to 39.8% in 2023 (ranked 71st nationally). The team struggled to protect the ball, and this reflected in their overall offensive efficiency.
On the defensive end, UMass-Lowell showed a slight improvement in their opponents' shooting efficiency, which decreased from 39.3% in 2022 (ranked 72nd nationally) to 37.7% in 2023 (ranked 71st nationally). While the improvement in defensive efficiency was marginal, their ability to limit their opponents' shooting efficiency demonstrates some progress in their defensive performance. Now they'll see if they can move up the table a bit in 2024.
In the possession game, UMass-Lowell had an extremely challenging season with a per-game possession margin of -10.7 (ranked 74th nationally), which was worse than the previous season's fairly respectable -1.6 (ranked 45th nationally). This decline was largely influenced by their struggles in faceoffs, as their opponent-adjusted win rate dropped from 49.6% in 2022 (ranked 37th nationally) to 32.9% in 2023 (ranked 74th nationally). The significant decrease in faceoff win rate contributed to their negative possession margin, hindering their ability to generate offensive opportunities and putting a ton of pressure on their defense.
Overall, UMass-Lowell's offensive struggles (thanks to an increased turnover rate) and decline in faceoff win rate exemplify what was ultimately a challenging and disappointing season for the team. These statistical areas played a significant role in their lower LaxElo ranking and inability to capitalize on scoring opportunities and maintain possession. It will be crucial for the team to address these issues moving forward in order to see improvement in their performance.
If you want 5-10 minutes of team and player analysis in your inbox every morning, sign up for Expected Goals here.
Data Engineer/Lacrosse Fan --- Twitter: @laxreference --- Informed fans get Expected Goals, the new daily newsletter from LacrosseReference
-
laxreference
- Posts: 1128
- Joined: Wed Aug 29, 2018 3:54 pm
- Contact:
Re: Lacrosse Analytics
This was originally published in the Fri Nov 3, 2023 edition of Expected Goals, my daily newsletter.
Chris Kavanagh's 2023 season with the Fighting Irish saw a significant increase in his role within the offense, notably in his share of the team's shots which jumped from 10.8% in 2022 to a significant 16.9% in 2023. This added responsibility seems to have suited Kavanagh; he was able to actually improve on his 2022 ball security, ranking in the 90th percentile this year, up from the 75th percentile two years ago. It all added up to a season that rated a 74 (out of 100 points; it's a Madden-style scale) for individual player efficiency, an improvement from the 57 he scored in 2022.
A closer look at his performance reveals contrasting stretches of games that provide insight into his skills and contributions to the team. Kavanagh's best four-game stretch took place early, between February 15 and March 4, with games against Marquette, Cleveland State, Georgetown, and Maryland. His individual efficiency rating during this period was very solid, ranking in the 91st percentile. His performance during these games also saw him taking on a larger role as a distributor since he recorded nearly 16% of the team's assists during this stretch.
In contrast, Kavanagh's worst stretch (by efficiency anyway) occurred between May 13 and May 29, where the Fighting Irish faced Utah, Johns Hopkins, Virginia, and Duke. (And earned the program's first national championship.) During this period, his individual efficiency dipped to the 37th percentile, and his share of the team's assists fell to 11.1%. However, it's noteworthy that despite these fluctuations in Kavanagh's performance, the team's record remained unblemished, with Notre Dame winning all games during both his best and worst stretches.
When comparing his best and worst stretches, shooting efficiency and assist rate stand out as significant factors. During his best stretch, Kavanagh boasted a 99th percentile shooting efficiency, compared to a 38th percentile during his worst stretch. Similarly, his assist rate was significantly higher in his better games, ranking in the 74th percentile compared to the 31st percentile in his less impressive performances. I actually think the assist rate here is the more interesting indicator, despite registering the smaller drop. I haven't done enough research on this, but the hypothesis is that a player who is looking to create assists will take only good shots, which should increase both shooting efficiency and assist rate. Sometimes, you just need a guy to go get a goal, and a team full of players looking to pass won't score. So it's not to say that he should have passed more during his rough stretch, but you wonder if maybe a more well-rounded approach would have led to a higher efficiency number?
Despite these ups and downs, Chris Kavanagh's performance remained reliable, with his ball security consistently ranking above the 80th percentile. And even though Kavanagh's performance varied, the team's success did not hinge on his individual contributions, indicating a well-rounded team not overly reliant on one player putting up high-efficiency performances. This balance within the team structure is a testament to the Fighting Irish's strength and depth.
In conclusion, Chris Kavanagh's 2023 season was marked by an increased role within the team, notable improvements in ball security, and a significant role in the team's assists. Despite the differences in his performance during his best and worst stretches, Kavanagh's overall contributions positioned him as a key player for Notre Dame.
Get smarter about college lacrosse in 5 minutes per day. Sign up for Expected Goals today.
Data Engineer/Lacrosse Fan --- Twitter: @laxreference --- Informed fans get Expected Goals, the new daily newsletter from LacrosseReference
-
laxreference
- Posts: 1128
- Joined: Wed Aug 29, 2018 3:54 pm
- Contact:
Re: Lacrosse Analytics
This was originally published in the Sat Nov 11, 2023 edition of Expected Goals, my daily newsletter.
The schedule is out for Penn, and it's clear that they have set themselves up with a very challenging slate of opponents. In our simulations, which start from last year's LaxElo rankings (adjusted for off-season movement), the Quakers averaged 7.1 wins and 5.9 losses in their 13 games. With this, Penn's all-important RPI fell within the 8 to 18 range in 50% of the simulations. Obviously, that means a quarter of the time they finished better than 8th and a quarter of the time, they were worse than 18th.
The simulations also produce an estimate of their final RPI-based Strength-of-Record, which takes into account good wins/bad losses. This approach looks less favorably on the Quakers prospects. Their SOR 50% range was 15th to 28th, which is significantly worse than their RPI range. I think about the SOR number as being a measure of RPI-skepticism. An SOR that is worse than a team's RPI suggests that their resume may be more likely to have either a) a dearth of quality wins or b) a bad loss or two. In Penn's situation, I'd suspect the former is probably the cause of the less-than-stellar SOR projection.
The 2024 schedule does not veer drastically from the previous year. With 11 out of the 12 opponents from the previous season making a repeat appearance on this year's schedule. Against those 12 teams, Penn finished with a 7-5 record last year. Two new additions to the schedule are North Carolina and Delaware. The LaxElo model projects a win probability of 61.9% and 54.7% respectively for these games. These new matchups add an interesting dynamic to the season, as Penn has not played either team in the shot-clock era.
In terms of difficulty, the 2024 schedule doesn't differ significantly from 2023. The average LaxElo team strength ranking places Penn's Strength-of-Schedule at 2nd, indicating a tough slate. If we compare their projected SOS against the SOS for every team in 2023, only one team had a more difficult schedule. The Non-Conference Strength-of-Schedule rating for Penn also stands at 2nd, again indicating a difficult lineup. This shows that Penn's non-conference lineup is just as tough as the conference ones. It's clearly a trial-by-fire type philosophy here.
The season's toughest stretch for Penn is projected to be from March 1st to March 19th, where they will face Duke, North Carolina, Villanova, and Saint Joseph's. With the LaxElo ratings as they stand right now, Penn is expected to score 1.9 wins during this period. On the other hand, the easiest stretch is likely to be from March 19th to April 13th, where Penn is expected to bag 2.5 wins against Saint Joseph's, Dartmouth, Yale, and Harvard. Yes, they overlap, which makes that pivotal March stretch even more interesting. Barring a let-down, the Quakers would be in great shape if they can find three wins in those four tough games.
Another tricky period for Penn will be from February 20th to March 3rd, where they will have to play four games in 13 days against Albany, Delaware, Duke, and North Carolina. This is likely to test the team's depth and potentially limit the chances that they get that critical 3rd victory.
In conclusion, the Penn team's 2024 schedule presents an exciting mix of challenges and opportunities. While the level of difficulty is similar to last season's slate, it will definitely test the Quakers. It's clear that they've given themselves a shot, but you wonder if they'll be able to rack up enough wins to have a competitive resume come Selection Sunday.
If you want 5-10 minutes of team and player analysis in your inbox every morning, sign up for Expected Goals here.
Data Engineer/Lacrosse Fan --- Twitter: @laxreference --- Informed fans get Expected Goals, the new daily newsletter from LacrosseReference
-
laxreference
- Posts: 1128
- Joined: Wed Aug 29, 2018 3:54 pm
- Contact:
Re: Lacrosse Analytics
This was originally published in the Wed Nov 15, 2023 edition of Expected Goals, my daily newsletter.
Carter Page showcased remarkable strides in his performance during the 2023 season with Saint Joseph's, particularly in terms of his individual efficiency. Improving from the 48th percentile in 2022 to a commendable 62nd percentile this year, Page's progression is a testament to his dedication and skill refinement. This boost in individual efficiency is particularly noteworthy given that his role on the team remained largely unchanged, underscoring a genuine enhancement in his effectiveness on the field.
One of the most outstanding aspects of Page's season was his shooting efficiency, for which he rated a 94 (it's a 100-point, Madden-style scale). This impressive figure not only reflects Page's precision and decision-making when taking shots but also the fact that he had a relatively low proportion of his shots saved by the opposing goalie. Additionally, an 88th percentile ranking in ball security further illustrates his reliability and poise under pressure, a crucial skill that contributed substantially to his overall improved efficiency.
Page's best stretch of games, occurring between March 25th and April 8th against Duke, Richmond, Monmouth, and St. Bonaventure, saw the Hawks secure a 3-1 record. During this period, Page's individual efficiency soared to the 89th percentile. He took 20.6% of the team's shots, and his share of the team's assists was a good-for-him 8.3%. This was peak Page with a flawless top percentile rating for shooting efficiency and an exceptional 98th percentile rating for ball security. He posted a 20th percentile assist rate, during this period, which hammers home the point that Page was a finisher and when he was at his best, he still just did that one thing very well.
In contrast, Page's worst stretch from April 15th to May 4th, including games against Hobart, UMass, High Point, and High Point, also resulted in a 3-1 record for the Hawks. However, his individual efficiency rating dipped to the 20th percentile. His involvement decreased a smidge as he took just 15.0% of the team's shots and recorded even fewer assists. The shifts in his skill-based statistics were notable; his shooting efficiency dropped to the 61st percentile, and his ball security fell to the 46th percentile, alongside a 15th percentile assist rate. These figures suggest that Page's performance was not as dominant during this period, highlighting the importance of maintaining high levels of ball security and shooting efficiency to his overall impact. When you don't have the ability to shift into a pass-first mode, a drop in shooting effectiveness spells a drop in efficiency.
Throughout the season, Page's influence on the Hawks was not make-or-break for the team, as evidenced by the team's ability to maintain a winning record during both his strongest and weakest stretches. His 85th percentile usage rate and an impressive 92nd percentile share of the team's shots underline his central role on the backend of the offensive system. Yet, it's clear that Saint Joseph's was able to find success irrespective of fluctuations in Page's performance, signifying a well-rounded team with effective strategies to compensate for any individual variances.
To sum up, Carter Page's 2023 season was marked by significant individual improvement and a high level of performance that contributed to the Hawks' success. His exceptional shooting efficiency and ball security stand out as the cornerstone of his enhanced efficiency, providing a solid foundation for his team's offensive endeavors. As Page maintained a consistent and crucial role within the team, his elevated play was a key ingredient in the Hawks' competitive formula throughout the year.
Get smarter about college lacrosse in 5 minutes per day. Sign up for Expected Goals today.
Data Engineer/Lacrosse Fan --- Twitter: @laxreference --- Informed fans get Expected Goals, the new daily newsletter from LacrosseReference
-
laxreference
- Posts: 1128
- Joined: Wed Aug 29, 2018 3:54 pm
- Contact:
Re: Lacrosse Analytics
This was originally published in the Sun Nov 19, 2023 edition of Expected Goals, my daily newsletter.
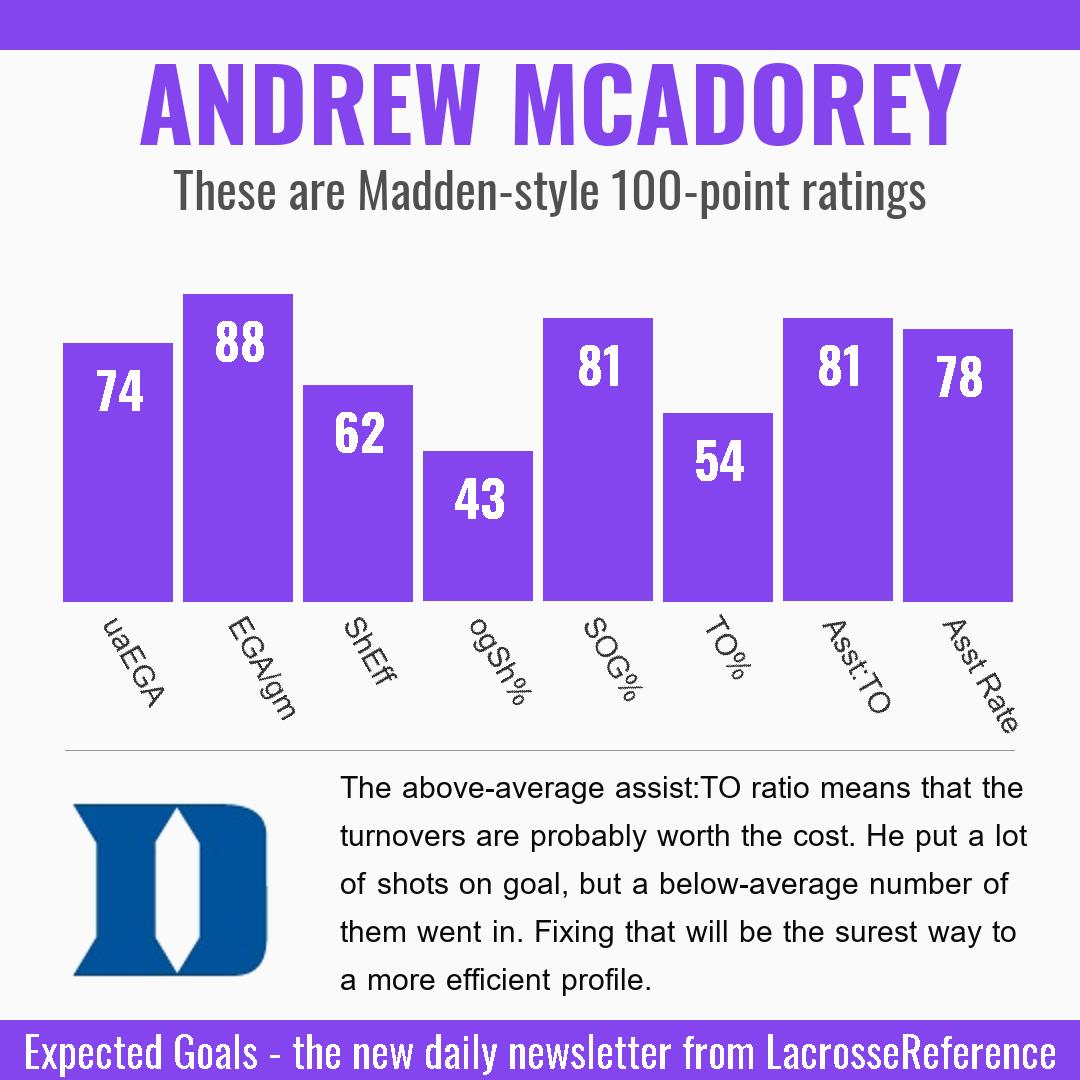
Andrew McAdorey's 2023 season with the Duke Blue Devils was marked by a meaningful increase in his role within the offense, as evidenced by his increased usage rate, which jumped from 5.7% in 2022 to 8.4% in 2023. This increased involvement in the Duke system was a testament the staff's confidence in his abilities. It was a solid season efficiency-wise, which is the top-line measure I typically use to assess how well someone played.<p style='text-align:center'><img style='width:50%;' src='https://storage.googleapis.com/images.p ... ic2023.jpg' /></p>One of the most notable aspects of McAdorey's season was his improved ball security, which saw a substantial rise from the 46th percentile in the previous year to the 62nd percentile, highlighting his development in protecting the ball and making good decisions. Additionally, his shooting efficiency remained robust, placing him in the 68th percentile, and his individual player efficiency, although slightly down from the previous year's 80th percentile, was still a very solid 76 on our 100-point, Madden-style scale.
His best stretch of games, from April 29 to May 20 against Syracuse, Merrimack, Delaware, and Michigan, showcased peak-McAdorey. During this period, his individual efficiency rating leaped up to the 92nd percentile. A critical factor in this success was his exceptional shooting efficiency, ranking in the 99th percentile, coupled with respectable ball security and assist rate, both in the 71st percentile. The impressive stats during this stretch were indicative of his potential and value, especially as a finisher, when things were clicking.
Conversely, McAdorey's most challenging period of the season was between March 17 and March 31, facing North Carolina, Air Force, Saint Joseph's, and Virginia. Despite the team's success, his individual efficiency rating dipped to the 28th percentile. This decline was driven by his skill-based statistics, with shooting efficiency at the 41st percentile, ball security significantly lower at the 13th percentile, and an assist rate in the 36th percentile.
These games highlighted areas where McAdorey struggled compared to his more successful stretches. For one thing, during his best stretch, he was more likely to score as an assister. He had 13% of the team's assists during his best stretch, compared to just 6% during his worst stretch. It's hard to say just from the stats, but it feels like pass-first McAdorey was a much more efficient player. His shooting was off-the-charts in these situations, which suggests that his shot-selection was better too.
Despite the fluctuations in McAdorey's performance, Duke's ability to maintain a perfect record during both his best and worst periods demonstrated the team's depth and resilience.
Throughout the season, McAdorey's elevated role and improved skills were key to his overall impact on the field. While his contributions varied, his development and performance were integral to the team's offensive strategies. The differences in his performance during his best and worst stretches offered insights into the factors that contributed to his success and highlighted the areas where he excelled. Overall, McAdorey's season was a testament to his growth as a player and his importance to the Duke lacrosse program.
Get smarter about college lacrosse in 5 minutes per day. Sign up for Expected Goals today.
Data Engineer/Lacrosse Fan --- Twitter: @laxreference --- Informed fans get Expected Goals, the new daily newsletter from LacrosseReference
-
laxreference
- Posts: 1128
- Joined: Wed Aug 29, 2018 3:54 pm
- Contact:
Re: Lacrosse Analytics
This was originally published in the Wed Dec 6, 2023 edition of Expected Goals, my daily newsletter.
In the 2023 season, Canisius' offense exhibited modest growth, with a 1.9 percentage point increase in offensive efficiency, moving up from 25.0% (64th nationally) to 26.9% (54th nationally). Key to this uptick was the improved shooting percentage, which went up from 24.1% (64th nationally) to 26.1% (55th nationally). An example of individual contribution to this positive shift is Hunter Parucki, who shot 28.3% in 2023. That is up from 23.2% in 2022.
On defense, the team was more or less the same as the 2022 team, ending the season with a defensive efficiency of 37.5% (70th nationally), a slight deterioration from the previous season's 37.0% (69th nationally). The underlying issue was the increase in shots-per-possession allowed, from 1.14 (69th nationally) to 1.24 (75th nationally), indicating the unit was giving up a lot of second chances. However, this was somewhat mitigated by a more positive turnover rate, which improved from 22.9% (71st nationally) to 25.5% (70th nationally), reflecting a better ability to disrupt the opponents' offense. Still, considering the increase in turnovers, the fact that they allowed even more shots on a per-possession basis is surprising. The defense just did not have the ability to make opposing offenses uncomfortable.
The possession game for Canisius was better, with their per-game possession margin improving from -4.1 (58th nationally) to -2.1 (51st nationally). This was supported by an improved clearing rate, which climbed from 85.9% (68th nationally) to 87.8% (63rd nationally), indicative of more successful transitions from defense to offense. Despite this improvement, the team still struggled to control the possession battle, a critical aspect of the game influencing both offensive and defensive opportunities.
The defensive statistics, specifically the increased shots-per-possession allowed, encapsulated what was ultimately a challenging season for Canisius. While they managed to create more turnovers, the defense's inability to limit opponents' 2nd chance opportunities is reflective of the overall difficulties the team faced in mitigating scoring chances. This, coupled with the offense's modest improvements and the possession game's limited gains, paints a picture of a season marred by defensive challenges that the team could not fully overcome.
If you want 5-10 minutes of team and player analysis in your inbox every morning, sign up for Expected Goals here.
Data Engineer/Lacrosse Fan --- Twitter: @laxreference --- Informed fans get Expected Goals, the new daily newsletter from LacrosseReference
-
laxreference
- Posts: 1128
- Joined: Wed Aug 29, 2018 3:54 pm
- Contact:
Re: Lacrosse Analytics
This was originally published in the Sun Dec 10, 2023 edition of Expected Goals, my daily newsletter.
As we delve into Villanova's roster for the upcoming 2024 season, it’s apparent that the team is facing a significant transformation, particularly on the offensive front. The Wildcats return a mere 42% of their offensive production from last year's roster (measured by total EGA). This substantial turnover leaves a void of experience and proven success, signaling a season of rebuilding, or more optimistically, reloading and adaptation for the team's offensive strategy.
Among the returning players, Matt Licata is poised to take on a more central role. His previous season's statistics are promising. His individual efficiency rated a 56 on our 100-point Madden-style scale. He took 12% of the team's shots and recorded 14% of their assists. The question is whether he's able to maintain those efficiency numbers as he steps into a larger role with the extra defensive attention that will bring. Incoming transfer Thomas McIntire (Holy Cross) is another guy who you'd expect to play a role this year. Although his efficiency last season was moderate (47th percentile), his experience should help bolster the team’s offensive unit.
On the defensive end, particularly at goalie, Villanova is essentially starting from scratch with the departure of Will Vitton, who was a cornerstone of their defense last season. The introduction of transfer Garrett Fitzsimons offers some solace. His experience with Bates could be something that they build around. Freshman Spencer Day is also joining the ranks, and while his collegiate level performance is yet to be seen, his addition adds depth to the goalie position that is without last year's starter.
The void left by the departure of Matt Campbell cannot be overstated. As Villanova’s premier offensive player last year, he took 23% of the team's shots and recorded 24% of their assists. Despite his individual efficiency rating being in the 46th percentile, his role as a primary offensive force was undeniable. Filling his shoes will require a collective step-up from the current roster, and perhaps a different approach to the offense that leverages the existing talents more effectively.
In the coming season, Villanova’s reliance on the transfer portal and incoming freshmen is not just a strategy but a necessity. With such significant losses in production, the integration of new players with what's leftover from last year will be a defining factor for the team's success or struggles. It will be interesting to see how the coaching staff molds this mix of new talent and existing players into a cohesive unit on the field. As the Wildcats embark on this transition, all eyes will be on how these changes play out within the context of this offense.
Get smarter about college lacrosse in 5 minutes per day. Sign up for Expected Goals today.
Data Engineer/Lacrosse Fan --- Twitter: @laxreference --- Informed fans get Expected Goals, the new daily newsletter from LacrosseReference
Re: Lacrosse Analytics
So this is an advertisement?
-
laxreference
- Posts: 1128
- Joined: Wed Aug 29, 2018 3:54 pm
- Contact:
Re: Lacrosse Analytics
This was originally published in the Mon Dec 11, 2023 edition of Expected Goals, my daily newsletter.
The St. John's Red Storm defensive unit was a mediocre unit, although a better one than the raw numbers suggest. In terms of raw defensive efficiency, the team was in the lower quartile nationally, ending up in the 23rd percentile. However, when accounting for the strength of their opponents' offenses, they fared better, reaching the 42nd percentile. This makes them the 44th ranked defensive unit in the country. The most notable aspect of their defense was their ability to limit shots per possession, adjusted for the opponent, where they ranked in the 77th percentile.
Diving deeper into their statistical profile, St. John's had some ups and downs on the defensive end. Their best four-game stretch occurred from March 18 to April 8, where, despite losing all four games, they achieved an adjusted defensive efficiency in the 97th percentile. On the flip side, their lowest point was between February 25 and March 11, with an efficiency in the 13th percentile. The stark contrast between these periods was largely attributable to the opponent's on-goal shooting percentage, which was 38% during their best defensive games and 52% during their worst. It's probably a positive sign that their best stretch was later in the season, suggesting that either their defense got better at preventing high quality shots or their keepers got better at stopping them.
When focusing on matchups against conference peers and LaxElo teams of similar rank, the importance of shooting defense shows up again. They didn't win any of these games, but we can use the defensive efficiency numbers to gauge the strength of the defense. In games where they allowed a shooting percentage of more than 37.5%, their defensive efficiency was 38%. When they were able to hold opponents below this mark, their efficiency was 31%. Again, it's hard to say whether this is a defensive issue or a goalie issue, but it wasn't a turnover-reliant defense. It was about preventing high quality chances.
The duration of the opposing team's possession also played a role in St. John's defensive success. Their performance was average when facing quick possessions under 20 seconds or lengthy ones over 60 seconds. However, they struggled during possessions lasting between 40 and 60 seconds, allowing goals at a rate that is 7.3 percentage points above the national average. This specific struggle during mid-length possessions added a layer of complexity to an already challenging defensive campaign for St. John's.
Overall, the St. John's defense had moments where they were able to limit the opportunities of their opponents effectively, but consistency eluded them throughout the season as they dealt with fluctuations in performance against various teams and situations. The detailed statistics not only shed light on their defensive capabilities but also their vulnerabilities, painting a comprehensive picture of a squad that faced its fair share of defensive challenges over the course of the year.
If you want 5-10 minutes of team and player analysis in your inbox every morning, sign up for Expected Goals here.
Data Engineer/Lacrosse Fan --- Twitter: @laxreference --- Informed fans get Expected Goals, the new daily newsletter from LacrosseReference
-
laxreference
- Posts: 1128
- Joined: Wed Aug 29, 2018 3:54 pm
- Contact:
Re: Lacrosse Analytics
This was originally published in the Fri Dec 22, 2023 edition of Expected Goals, my daily newsletter.
As the Bryant team gears up for the 2024 season, their posted schedule offers a mix of challenges and opportunities. The simulations we've run project an average of 9.3 wins and 4.7 losses for the Bulldogs, with a 50% likelihood of landing an RPI in the 24-34 range. The Strength-of-Record, which factors in the quality of wins and the impact of losses, suggests a slightly lower ranking in the 28-40 range for half of the outcomes. This discrepancy indicates a potential perception penalty due to a possible lack of high-profile victories.
Breaking down the schedule, Bryant faces a lot of familiar faces, with 13 of their 14 opponents being teams that they played last year. Against these repeat opponents, Bryant put together a strong 12-3 record in 2023. The introduction of Harvard to the schedule presents an opportunity for a solid win, with a 60.4% win probability favoring Bryant in this new matchup. Conversely, the absence of Air Force, a team that has historically challenged Bryant, could be seen as a relief, given the Bulldogs' 0-2 record against them in the shot-clock era.
Analyzing the strength of schedule, Bryant's overall lineup projects as the 59th toughest, a slight drop from last year's 53rd. The non-conference slate remains almost unchanged in difficulty, ranking 45th compared to last year's 44th. This signals an approach to bolster the team's resilience in preparation for conference play while aiming to avoid overextending and potentially diminishing the team's confidence and momentum.
The season's most challenging stretch spans from April 6th to April 23rd, where Bryant faces off against Albany, Vermont, Binghamton, and Brown. The expectation line for this gauntlet of games is 2.3 wins. If they can get 3 victories in this stretch, that will be a very solid effort. In contrast, the period from March 6th to March 30th appears more forgiving, with anticipated matchups against Fairfield, UMBC, UMass-Lowell, and NJIT projecting a more comfortable 3.4 wins. This early stretch could serve as a platform for building team confidence and momentum.
The Bulldogs will also endure a grueling stretch from April 13th to April 27th, playing four games in 15 days, including high-stakes encounters with Vermont, Binghamton, Brown, and Merrimack. This period will be telling of the team's depth and ability to maintain effectiveness with what could be some tired legs.
In summary, the Bryant schedule for 2024 presents a balanced challenge with the potential for a top-20 RPI if things break right for them. The slight shifts in scheduling from the previous year, including the addition of Harvard and the exclusion of Air Force, lessen the strength of the schedule, but open the opportunity for a better record. The toughest and easiest stretches of the season are clearly defined, with critical implications for the team's success. Bryant's strategic non-conference scheduling aims to prepare the Bulldogs for the rigors of conference play while also securing enough wins to foster a winning mentality heading into the postseason.
If you want 5-10 minutes of team and player analysis in your inbox every morning, sign up for Expected Goals here.
Data Engineer/Lacrosse Fan --- Twitter: @laxreference --- Informed fans get Expected Goals, the new daily newsletter from LacrosseReference
-
laxreference
- Posts: 1128
- Joined: Wed Aug 29, 2018 3:54 pm
- Contact:
Re: Lacrosse Analytics
This was originally published in the Mon Dec 18, 2023 edition of Expected Goals, my daily newsletter.
The possession game for Detroit was a major area of struggle in the 2023 season. They ended with a per-game possession margin of -9.1 (72nd nationally), indicating a significant deficit in controlling possession compared to their opponents. This was driven by their faceoff win rate, which dropped from 41.4% in 2022 (63rd nationally) to a dismal 34.5% in 2023 (73rd nationally), resulting in fewer offensive opportunities and a greater burden on their defense.
On the offensive side, Detroit's efficiency was stagnant, with a 22.5% efficiency in both the 2022 and 2023 seasons (70th nationally). While they did see a slight improvement in turnover rate, going from 35.9% in 2022 (59th nationally) to 32.9% in 2023 (49th nationally), it was not enough to significantly impact their overall offensive performance. The lack of consistent improvement in efficiency suggests ongoing challenges in generating quality scoring opportunities.
Defensively, the team struggled as well, ending the season with a 36.4% efficiency (67th nationally), a regression from the previous season's 33.4% (57th nationally). The key contributing factor was their opponents' shots-per-possession, which increased from 1.04 in 2022 (48th nationally) to 1.16 in 2023 (71st nationally). This indicates a difficulty in limiting their opponents' shot opportunities, putting additional pressure on the defense and goalkeeper.
Overall, the possession game, exemplified by the abysmal per-game possession margin and significantly low faceoff win rate, was a major contributor to Detroit's struggles in the 2023 season. The inability to control possession limited their offensive output and increased the defensive workload. Combined with stagnant offensive efficiency and defensive challenges in preventing quality shots, it was a season marked by consistent shortcomings and difficulties in finding success on the field.
Get smarter about college lacrosse in 5 minutes per day. Sign up for Expected Goals today.
Data Engineer/Lacrosse Fan --- Twitter: @laxreference --- Informed fans get Expected Goals, the new daily newsletter from LacrosseReference
-
laxreference
- Posts: 1128
- Joined: Wed Aug 29, 2018 3:54 pm
- Contact:
Re: Lacrosse Analytics
This was originally published in the Fri Dec 29, 2023 edition of Expected Goals, my daily newsletter.
As the Fairfield Stags gear up for the 2024 season, they're walking onto the field with a roster that's seen significant churn since last year. With 54 players, the team's lineup is slightly leaner; they had 55 last year. But it's a pretty standard-sized roster, so you wouldn't expect to have any particular depth concerns.
The Stags' faceoff unit looks like a beacon of stability, thanks to the return of Dylan Smith, who not only brings experience but also demonstrated skill, having been in the 97th percentile for total faceoff-related production. His near 50% win rate is a solid foundation for the Stags to try and build upon. He finished the year as the 49th best FOGO in the country for a unit which finished the year in the 26th percentile. With 98% of their faceoff experience returning, Fairfield is poised to fortify this aspect of their game, potentially giving them less of a possession deficit and, by extension, more control over the pace of their games.
The offensive end of the field tells a different story. The departure of key players, like the sharpshooter Jack McKenna, means that Fairfield is now tasked with replenishing a full 42% of their offensive output. McKenna's absence leaves a significant void, given that he took 18% of the team's shots, and his replacement's efficiency will critically impact the team's scoring capabilities. The onus will likely fall on players like Bryce Ford and Will Consoli, who have shown promising glimpses of their scoring abilities, to step up and fill the gap. Ford, with his commendable efficiency rating (69 on our 100-point scale) and 23% of the team's assist total, seems primed to become a more central figure in the offensive scheme. Consoli is a guy that will need to be more efficient if he's to take on a larger role. He finished the year with a 29 rating for individual efficiency.
Looking ahead, the Fairfield offense has a considerable hill to climb. After finishing in the lower half nationally in terms of opponent-adjusted offensive efficiency (42nd percentile), the loss of such a significant percentage of their contributors could either be a stumbling block or an opportunity for new talent to emerge and propel the team forward. But it all depends on whether the fresher faces that outperform McKenna's 52 rating for individual efficiency. An offense is the sum of its parts.
In sum, Fairfield's roster reflects both promise and challenges. The continuity at faceoff is encouraging, but the offensive losses are a hurdle that will test the team's adaptability and depth. As the Stags look to reverse their fortunes, the real litmus test will be whether the fresh faces on the roster can translate potential into performance and improve upon last year's benchmarks. The coming season will be a proving ground, not just for individual talent but for the program's collective ability to take a step out of the lower ranks in college lacrosse.
If you want 5-10 minutes of team and player analysis in your inbox every morning, sign up for Expected Goals here.
Data Engineer/Lacrosse Fan --- Twitter: @laxreference --- Informed fans get Expected Goals, the new daily newsletter from LacrosseReference
-
laxreference
- Posts: 1128
- Joined: Wed Aug 29, 2018 3:54 pm
- Contact:
Re: Lacrosse Analytics
This was originally published in the Sun Dec 31, 2023 edition of Expected Goals, my daily newsletter.
As Bellarmine Knights gear up for the 2024 season, their schedule offers a revealing glimpse into their potential performance. After running their schedule through the LaxElo simulations, the team is expected to end up with an average of 9.7 wins against 6.3 losses, indicating a competitive but challenging season ahead. In terms of ranking metrics, the most likely range for the Knights' RPI is between 40th and 50th. They finished 34th in the RPI last year, so they'll need to beat their benchmark to match that performance. The 40 to 50 range is based on where 50% of the simulations ended up, which means that in 25% of the simulations, they did finish better than 40th.
When comparing the non-conference strength-of-schedule to the overall strength-of-schedule, Bellarmine's non-conference lineup for 2024 is ranked 67th, showcasing a relatively lighter load compared to the entire season's 57th ranking. It looks like their approach was to have the non-conference games serving as a developmental platform for the team before they delve into the more rigorous conference play.
Examining the 2024 schedule against the previous year, Bellarmine has basically just run it back. With 14 out of 15 opponents from the 2023 season making a reappearance, the team faces a familiar set of challenges. The non-conference schedule has eased up, with Hampton replacing VMI. That, combined with the change in their opponents' LaxElo ratings, means that this year's non-conference slate projects as the 67th toughest, compared to the 56th ranking it had least year. This adjustment could bode well for the Knights, allowing them to bolster their record and confidence before engaging with tougher conference adversaries.
The season's most arduous stretch spans from March 2nd to March 20th, with the Knights hosting Marist, Marquette, Utah, and traveling to Mercer. During this stretch, Bellarmine is expected to come away with approximately 2.3 wins, marking it as a crucial period for maintaining their competitive edge. Conversely, the easiest stretch occurs from February 10th to February 27th, where matchups against St. Bonaventure, Ohio State, Canisius, and Hampton are predicted to yield around 3.1 wins, offering a valuable opportunity for the team to accumulate victories and build momentum.
Finally, the most grueling segment, both in terms of frequency and travel, is set from March 9th to March 23rd. Four games in two weeks, including a stretch involving Marquette, Utah, Mercer, and Queens, will test Bellarmine's stamina and depth. How the Knights manage this period could very well set the tone for the rest of their season. And given the overlap with their toughest stretch, winning 2 out of these 4 games would qualify as a success.
In essence, Bellarmine's 2024 schedule seems to balance the need for developing their younger players will getting ready for conference play. While the non-conference games present a chance for growth and refinement, the season's more difficult stints will test the team's resilience and preparedness for post-season aspirations. With careful navigation through their calendar, the Knights will look to position themselves advantageously for when it matters most.
Get smarter about college lacrosse in 5 minutes per day. Sign up for Expected Goals today.
Data Engineer/Lacrosse Fan --- Twitter: @laxreference --- Informed fans get Expected Goals, the new daily newsletter from LacrosseReference
-
laxreference
- Posts: 1128
- Joined: Wed Aug 29, 2018 3:54 pm
- Contact:
Re: Lacrosse Analytics
This was originally published in the Fri Jan 5, 2024 edition of Expected Goals, my daily newsletter.
In the 2023 season, Brown's performance against conference opponents and teams with comparable LaxElo rankings revealed significant statistical patterns that correlated with their success (or lack thereof) on the field. The analysis, which encompassed 13 games, showed Brown with a record of 6 wins and 7 losses against these teams, indicating a competitive but inconsistent season. Our goal now is to try and isolate the metrics that really mattered.
A critical statistical threshold for Brown's offense was their shot-on-goal rate. In the 4 games where the team exceeded a 65.3% shot-on-goal rate, their record was perfect at 4-0, and they boasted an impressive scoring efficiency of 39%. However, this was not a regular occurrence, and in the 9 games where they were below this threshold, their record dipped to 2-7, with a reduced efficiency of 26%.
Shooting percentage also played a pivotal role in their outcomes. Brown went 3-1 when their shooting percentage was above 35.1%, and they scored on 40% of their possessions in those games. In contrast, a sub-35.1% shooting percentage was correlated with a less favorable 3-6 record and a 26% scoring efficiency, highlighting the significance of shot conversion in their victories. Obviously shot-on-goal rate and shot quality are tied together, so I suspect that this is less about accuracy from their shooters and more about the ability of the offense to produce high-quality looks.
And in fact, the team's ability to create assists was another key factor, with a record of 6-3 when they assisted on more than 53.8% of their goals. This collaborative style of play coincided with a 32% scoring efficiency. Conversely, Brown struggled without such teamwork, as shown by a 0-4 record and a stagnant 26% efficiency when they assisted on fewer than 53.8% of their markers. Ball movement creates assists, and assisted shots go in at a higher rate. Ball movement and passing is the thread that ties all three of these statistical nuggets together.
Individual player contributions from Aidan McLane and Jack Kelly also correlated with team success, albeit to a lesser extent than team-wide metrics. McLane's presence as a playmaker was notable, with the team going 4-2 when he tallied at least one helper. Similarly, Kelly's goal-scoring ability positively impacted outcomes, with Brown achieving a 3-2 record when he scored at least 2 goals. The team went 2-5 and 2-3 respectively when these guys didn't hit their thresholds.
Overall, the statistical trends from Brown's season suggested that their offense thrived on collaborative playmaking, and to a lesser degree, key individual performances. The fluctuation in their record based on these metrics highlighted the team's reliance on their initiators to create movement in the defense and high quality chances for their shooters. When the offense was more of a one-on-one affair, they struggled.
If you want 5-10 minutes of team and player analysis in your inbox every morning, sign up for Expected Goals here.
Data Engineer/Lacrosse Fan --- Twitter: @laxreference --- Informed fans get Expected Goals, the new daily newsletter from LacrosseReference
-
laxreference
- Posts: 1128
- Joined: Wed Aug 29, 2018 3:54 pm
- Contact:
Re: Lacrosse Analytics
This was originally published in the Wed Jan 10, 2024 edition of Expected Goals, my daily newsletter.
Today, we turn our attention to the Air Force Falcons and the moderately difficult schedule they've put together for the 2024 season. The Falcons' lineup of games isn't a drastic departure in difficulty from last year; however, the introduction of new opponents promises a season of fresh challenges and the uncertainty that comes with an unfamiliar opponent. Balancing the rigors of competition with the need to build team confidence will be key. A tough schedule can forge a strong team ready for conference battles, but the risk of eroding the team's morale with too many losses is a real concern.
Our LaxElo model projections had the Falcons finished the regular season with an average of 8.8 wins against 5.2 losses. In the majority of the simulations, their final RPI was in the 27 to 37 range, settling below last year's finish at 26th. They'll need to out-perform their projections to improve on last year's finish. Granted, the LaxElo projections are based on an assumption that 2023 is a reasonable guide to what teams will look like in 2024.
The Falcons' calendar has some clear peaks and valleys. The most strenuous stint runs from February 10th to March 3rd, where Air Force confronts Denver, Ohio State, Stony Brook, and Saint Joseph's. The expected outcome here is a modest 1.8 wins, underlining the difficulty of this segment. Conversely, a gentler stretch from March 31st to April 17th pits them against Cleveland State, Bellarmine, Detroit, and Mercer, with a projected tally of 3.3 victories, offering a chance to build momentum. Again, the biggest challenges for Air Force will come before conference play.
When comparing the current schedule against last year's, the Falcons will see quite a bit of change. Twelve of last year's adversaries reappear, against whom Air Force finished 2023 with a 9-5 record. New matchups include Marquette, against whom Air Force won a 16-9 victory in 2022. The LaxElo model projections give the Falcons a 74.7% win probability against Marquette this season. They've yet to play Saint Joseph's in the shot-clock era, and the model thinks this will be a tougher lift for Air Force, with a win probability of 28.8%. The departure of Colgate, Bryant, and Duke from the schedule removes a collective .500 record for the Falcons in 6 recent contests. That does mask the differences a bit, as they have lost their last two against Duke and won their last two against Bryant.
But as mentioned above, despite the swapping, the difficult is not markedly different, with Air Force's non-conference Strength-of-Schedule projected to come in at 12th, a notch up from last year's 15th. Contrast that with the overall schedule's projected 37th ranking for SOS. The season will probably have a distinct U-shaped feel for Falcons-watchers.
In sum, the Falcons' 2024 schedule is a carefully calibrated mix of continuity and novelty. It retains much of last year's challenge level while introducing new elements that could test—and ultimately strengthen—the team's competitive edge. The schedule's design seems to align with the goal of propelling Air Force forward, building on last year's solid performance and potentially elevating their program further into the national consciousness.
If you want 5-10 minutes of team and player analysis in your inbox every morning, sign up for Expected Goals here.
Data Engineer/Lacrosse Fan --- Twitter: @laxreference --- Informed fans get Expected Goals, the new daily newsletter from LacrosseReference